How to Model a Product Metrics Dashboard (Part 1)
Hi BPL fam,
The summers are officially here. While some people will be making beeline to the parks & beaches, many PMs will be taking deep breaths to dive into end-of-quarter rituals.
Based on my conversations, several teams in Q2 got busy integrating AI into their products. It seems June will be dedicated to go-to-market planning for a barrage of Q3 announcements & releases.
But when we talk about quarterly reports & breakdowns, leadership obsesses over one thing: metrics. This edition (& the next) will focus on this topic.
Let’s dive into this edition. The agenda:
What’s on my mind: My top picks from the world of product, marketing & AI
Your opinion on topics for future newsletter editions
How to model a product metrics dashboard - Part 1
What’s on my mind: The Top Picks
PRODUCT MANAGEMENT
This simplified Product Strategy template from Ramp on LennysNewsletter got me thinking. I like how it ties strategy with clear metrics and enforces PMs to write down risks upfront.
Yaakov Carno shares some neat tips on framing your “blank states”. Blank states and microcopy introduce users to new features when there are no records to display. Critical for activation.
Elena Verna differentiates between B2B and B2C data, especially when it relates to revenue. Super important to understand if you’re leading product for a SaaS gig.
WORLD OF AI
I’ve been playing with SheetGPT lately - GPT for Google Sheets. It doesn’t need API keys to run it but the pricing can be a hurdle. It’s super useful to run batch commands like categorize a large set of customer feedback notes.
If you thought Adobe Firefly was cool, check out DragGAN. It leverages AI to show you different angles of objects in a picture. Insane.
Google Ads is getting an AI injection. This video demonstrates how AI-powered tools will help advertisers get better copy, improve their product images & generate better creatives.
MARKETING & GROWTH
Monday.com is now at $640 Million ARR - that’s 50% growth Year on Year. This goes to show that a PLG play paired tightly with a sales-led enterprise motion can unlock massive growth. Jason Lemkin has more.
Need a messaging template for your home page? Anthony Pierri weighs in on how to differentiate yourself in a crowded market with some nifty tips.
Chase Dimond breaks down 5 sales emails templates that help rake in revenue.
What topics do you want to learn about? Collaborate on Behind Product Line’s roadmap.
I often get DMs from PMs in my network asking about thoughts on different topics. I’m trying to democratize the process to figure out the most common, popular pains.
I’ve setup a Canny topic board which already lists a bunch of ideas. You can upvote questions you like OR post one of your own. Please make sure they aren’t already on there.
Click here: https://behind-product-lines.canny.io/questions-topics
Looking forward to your ideas!
How to model a Product Metrics dashboard
Every Product Manager has to wrap their heads around product metrics at some point to make sense of progress. The process of selecting the right metrics & putting them on a dashboard can get tedious.
This multi-part posts aims at giving you a helping hand on how to think about metrics.
Part 1 will cover:
Pre-requisite steps before selecting your metrics.
To identify the right metrics, you need to ask the right questions.
Crafting a Metric Tree to organize your thoughts (your dashboard blueprint).
Part 2 will cover:
Picking fitting visualizations for various metrics.
Choosing frequency of metrics: do you measure daily, weekly, monthly etc.
Intro to Radars: You can’t keep measuring every single metric as the product grows. We’ll discuss “Radars” to help you focus.
Let’s get into it.
Pre-requisites before selecting your metrics
Product metrics don’t live in a vacuum. You need top-down alignment on vision, company strategy and product strategy to make them meaningful.
This sounds like “fluff” to most Product Managers but the following pillars set the foundations of what one ought to measure:
You start with some vision - the promised land so to speak. It’s the change you want to affect in the world.
That vision informs the company-level strategy - how the company’s various departments come together to to realize it’s vision.
A company has different orgs within it like sales, product, marketing, legal, finance etc. The product strategy pertains to how the product org in particular will contribute to the overall company strategy.
So that’s: Vision → Company Strategy → Product Strategy → Goals & Metrics
It’s only after this that you can select metrics to see what how well the product strategy is being executed.
Let’s pause here.
What happens if you don’t work through a vision, company strategy or product strategy? What metrics would you select?
The usual suspects:
Basic activation metrics (e.g. bookings for a ride hailing app)
Revenue, churn, retention numbers.
Some feature-specific numbers (e.g. number of add-ons chosen at check-out for a delivery app)
The problem arises when you suddenly realize there’s a disconnect with what you’re measuring and what you need to affect. PMs usually find themselves in a constant flux of jumping to new metrics, instrumenting them in a haste only to modify them in the next iteration.
John Cutler says it best by describing it as “metrics theater”:
Now, let’s solidify the vision to product strategy approach with an example. Cut the fluff.
Let’s use the recruitment tech product category - an applicant tracking system (ATS). An ATS is recruitment software that helps HR source, manage and hire talent against open positions.
Our vision?
“A world where small businesses can find their next hire effortlessly.”
Our company-level strategy?
Move closer to our vision by:
Leveraging organic discovery and local reseller partnerships to target the SMB market, starting with retail & healthcare,
with a product that automates the hiring pipeline & makes smart recommendations based on AI,
using high-touch customer success processes to retain clients and expand them over time.
Note how the company strategy directs what the entire org will be pursuing.
Our product strategy?
Reduce adoption friction by laying out self-serve flows & making the hiring pipelines/workflows configurable
Delight employers by backfilling the system with candidates using partner integrations
Differentiate by cutting time-to-value down by leveraging AI to facilitate the job posting & recommendations process
Do this while ensuring that data privacy laws are respected
Great. Now we’re onto something.
I can now think of product metrics that align with the product strategy.
Asking the right questions to arrive at the right metrics
Before we start chalking out metrics, we have to stop and ask:
“What questions do I need these metrics to answer for me to measure my journey towards realizing my product strategy?”
This post from Saeed Khan hits a chord. Read this carefully.
Now, think of the example of the recruitment software we just discussed.
What are questions that you would ask on a regular basis to judge your progress on that product strategy?
Here are some examples:
How long does it take for a new user to complete the self-serve setup process?
What percentage of users successfully configure their hiring pipelines/workflows within the first week of sign-up?
How many support requests or queries are received related to the setup and configuration process?
How many partner-integrated candidates are added to the system on average per employer?
What is the employer satisfaction rate with the ease of use of the platform?
How does the time-to-value (time from sign-up to successful job posting) compare before and after the AI-facilitated process was implemented?
How many job postings are published on a daily/weekly/monthly basis?
What is the conversion rate of AI-recommended candidates to interviews?
What level of confidence do users express in the system's data privacy safeguards in feedback surveys?
This isn’t an exhaustive list. You might even have sub-questions. In certain cases, it might not be possible to get an answer for the question. That’s ok. (we’ll discuss proxy metrics in a bit)
The point is that the metric you’ll propose to measure needs to be associated with a question you need answered, NOT because it’s “seems like something we might want to track”.
Don’t come up with bogus questions either.
Here’s a great litmus test:
”Assume you are able to get the answer to your question. The metric associated with the question completely tanked in the last 2 weeks. Now, what’s your Step 2? Do you have some playbook to remedy the situation? If you can’t act on it, what use is it to you?”
In short, get really good at framing questions.
Crafting a Metrics Tree
The next step is to develop a metrics tree.
Woah - what’s that?
Metrics tree or KPI trees are visual tools that break down a high-level product or company goal into more digestible, easily measurable metrics. They’re typically used to measure employee performance.
There’s a main trunk node and then it’s branched out to branches (sub-goals).
Here’s what a metrics tree looks like:
Before we get into sketching, we need to first talk about the categories you’ll see on this tree. It’ll help you bucket the metrics appropriately.
At the top level, we have:
Customer Metrics: metrics that measure the acquisition, engagement & satisfaction of your customer base.
Business Metrics: the business goals laid out as a consequence of your company strategy.
While both are intrinsically related, all PMs don’t necessarily own the PnL sheet and might be slightly disconnected from business metrics. In certain cases, it may be owned by sales or leadership. Even so, it’s imperative for a PM to be aware of how the product growth is affecting business parameters.
A Product Manager, after all, has to solve a customer problem in a manner that it works for the business too. It’s not a charity.
Alright, next up, let’s add sub-categories to each.
Business Metrics can be further broken down into:
Topline Metrics such as Revenue, Profits, and Market Share
Recurrence Metrics like retention, logo churn, revenue churn, and Life Time Value (LTV)
Efficiency Metrics including Customer Acquisition Cost (CAC), Payback period, Return on Advertising Spend (ROAS), and Revenue per employee
Customer Metrics are can be divided into:
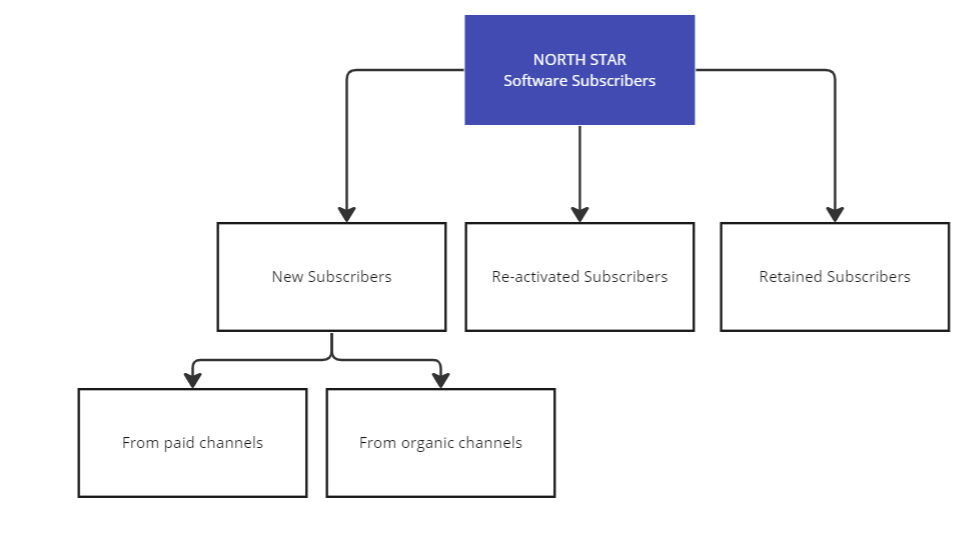
North Star Metric: This is the most important metric of focus. It represents the core value your product delivers to customers.
Acquisition Metrics indicate how quickly you’re acquiring customers.
Activation Metrics including visitor to trial, trial to paid conversions, and how many users use a specific feature.
Utilization Metrics like number of bookings, bookings per user, etc.
Retention Metrics like 7/14 day retention, churn rate etc.
Referral Metrics including average invitees, average invitation acceptance rate.
Satisfaction Metrics like Customer Effort Score (CES), Net Promoter Score (NPS), etc.
Let’s visualize these buckets.
Think about the constituents of each metric that makes it easy to measure progress of the parent metric.
Now, sometimes the north star metric isn’t measurable or can’t be directly tracked. Or it’s difficult to affect in the short run. In such cases, you have to nominate a proxy metric to measure progress.
For example, in this case, # of hires made is the selected North Star.
However, the hiring event happens outside the platform and very few recruiters come back and update the system about who they hired. Many recruiters leave the application in the offer stage (unless their org mandates it or ties an incentive on that reporting). While PMs should keep encouraging users to update the positions that have been hired for, a proxy metric like Number of Offers made could work well as a substitute.
Now, let’s go deeper.
These business and customer metrics can be broken down further to sub-metrics.
These sub-metrics are typically leading indicators that change more often and allow PMs to course-correct their strategies.
These sub-metrics can be of 2 types:
Elements: These are the constituent parts that combine to form the parent metric. They provide detailed insight into specific components that together contribute to the overall metric. For example, total website traffic (parent metric) can be broken down into paid traffic and non-paid traffic (element sub-metrics).
Hypothesis: These are metrics designed to measure the validity of an experiment or a theory. They are not necessarily components of a larger metric, but rather they are specific measures that help test an assumption or hypothesis. For instance, to test the hypothesis that new job postings attract immediate interest, you might measure the percentage of new jobs that receive more than 20 applications within the first 48 hours (hypothesis sub-metric).
Tip: select up to 2 hypothesis metrics at a time and base them on existing experiments. Typically, you should be able to affect these in the short-term with tactical changes. Don’t flood your tree with too many of these.
So, what sub-metrics should you choose to add?
Let your questions guide you.
Let’s do a few:
How does the time-to-value (time from sign-up to successful job posting) compare before and after the AI-facilitated process was implemented?
This sounds like an activation metric - something that graduates a user into an active user status.
Also, a related (and important) question would be how many new users are posting jobs in the first place.
Thus, you would add this along with a time-to-value metric to your tree.
Here’s another question:
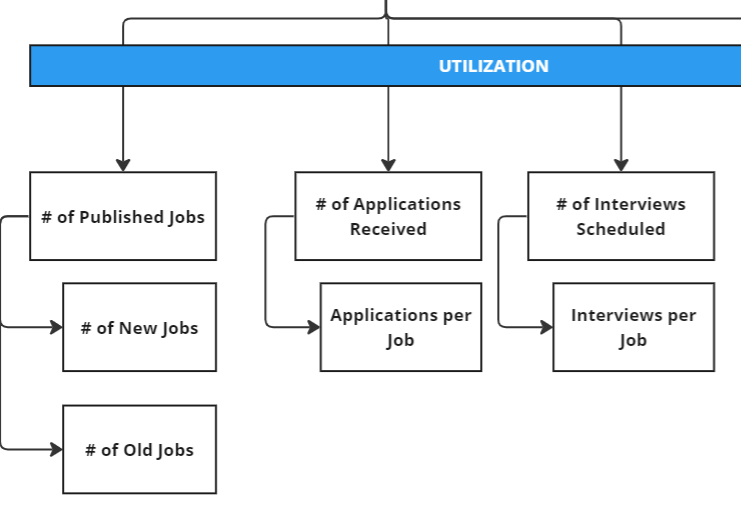
How many job postings are published on a daily/weekly/monthly basis?
That’s a simple one. It’s a utilization metric. You could potentially figure out how many jobs are live (entire footprint) and break those down into which ones got published recently. We’ll talk about frequency parameters later.
What would a hypothesis branch look like?
You could differentiate these with a dotted line.
Let’s do one final one.
What is the conversion rate of AI-recommended candidates to interviews?
This is also a utilization metric as it pertains to usage of a specific feature.
Here it focuses on how many applicants convert into interviews. This means we’d need to know the applicant volume and the interview volume. We could break this down like this:
Getting a hang of things?
As you go along this process, you’ll build out your entire tree. If you’re being forced to go beyond 3 vertical levels, it’s usually an indication of over-complication. Try to keep your tree simple.
Here’s a depiction of what it might look like:
Now, what happens if you had more actors in play e.g. a 2-sided marketplace where both buyers and sellers are participating? How would you adapt?
My personal preference has been to use 2 separate trees unless there are tight dependencies. Typically, in mature product orgs, you’d have 2 separate owners looking at each side and hence, that naturally allows for compartmentalization.
Let’s stop there for now.
In the next edition, I’ll share tips to decide how frequently each metric should be measured, how to pick visualizations, comparison of analytics tools, the concept of radars and a few more nuggets.
Hope you found this useful.


